
Taking a downturn after doubling its price in six weeks, Sol looks weak daily as it posted 11% losses in the last 7 days. It formed a new bearish pattern following yesterday’s breakdown and now signals a sell.
Following a strong bounce back above the crucial $100 level last month, Sol saw a major increase and reclaimed several resistance levels lost in the first quarter drops. But looking at the recent price action, it currently appears to have reached an overbought area on the daily chart.
The latest drops started last week after failing to push above $188. This price rejection came as a result of the daily buying exhaustion. The bears intercepted the move and took advantage of the buying weakness.
Looking at yesterday’s candle close, which confirms a breakdown on the 4-hour timeframe, it currently appears bearish and seems set for a bigger loss, although it has recovered briefly from the dip in the past hours.
Closing this month on a negative note, we can anticipate more drops in the next few days. If that happens, we may see a dip near the mentioned crucial level before climbing back. Losing April’s low in the process could trigger a huge collapse in the future. Towards the upside, Sol must retake the previous weekly high before considering more bullish rallies.
SOL’s Key Level To Watch
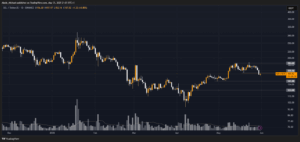
As soon as Sol retests the broken $159.5 support level as resistance, we can expect more bleeding to the $141 support, tested as April’s low. The further support levels to consider for a test are $123 and $112.
Pushing well above the mentioned broken resistance could bring us back to the $185 resistance with a potential rally to the $209 resistance.
Key Resistance Levels: $159.5, $185, $209
Key Support Levels: $141, $123, $112
- Spot Price: $157.5
- Trend: Bullish
- Volatility: Low
Disclosure: This is not trading or investment advice. Always do your research before buying any cryptocurrency or investing in any services.
No Comments